Responses & Results
Reading individual responses, analysing the whole set, and exporting the data.
Three tabs cover what came back: Responses for individual submissions, Analytics for the picture across all of them, and Team Analytics to compare the same results between teams.
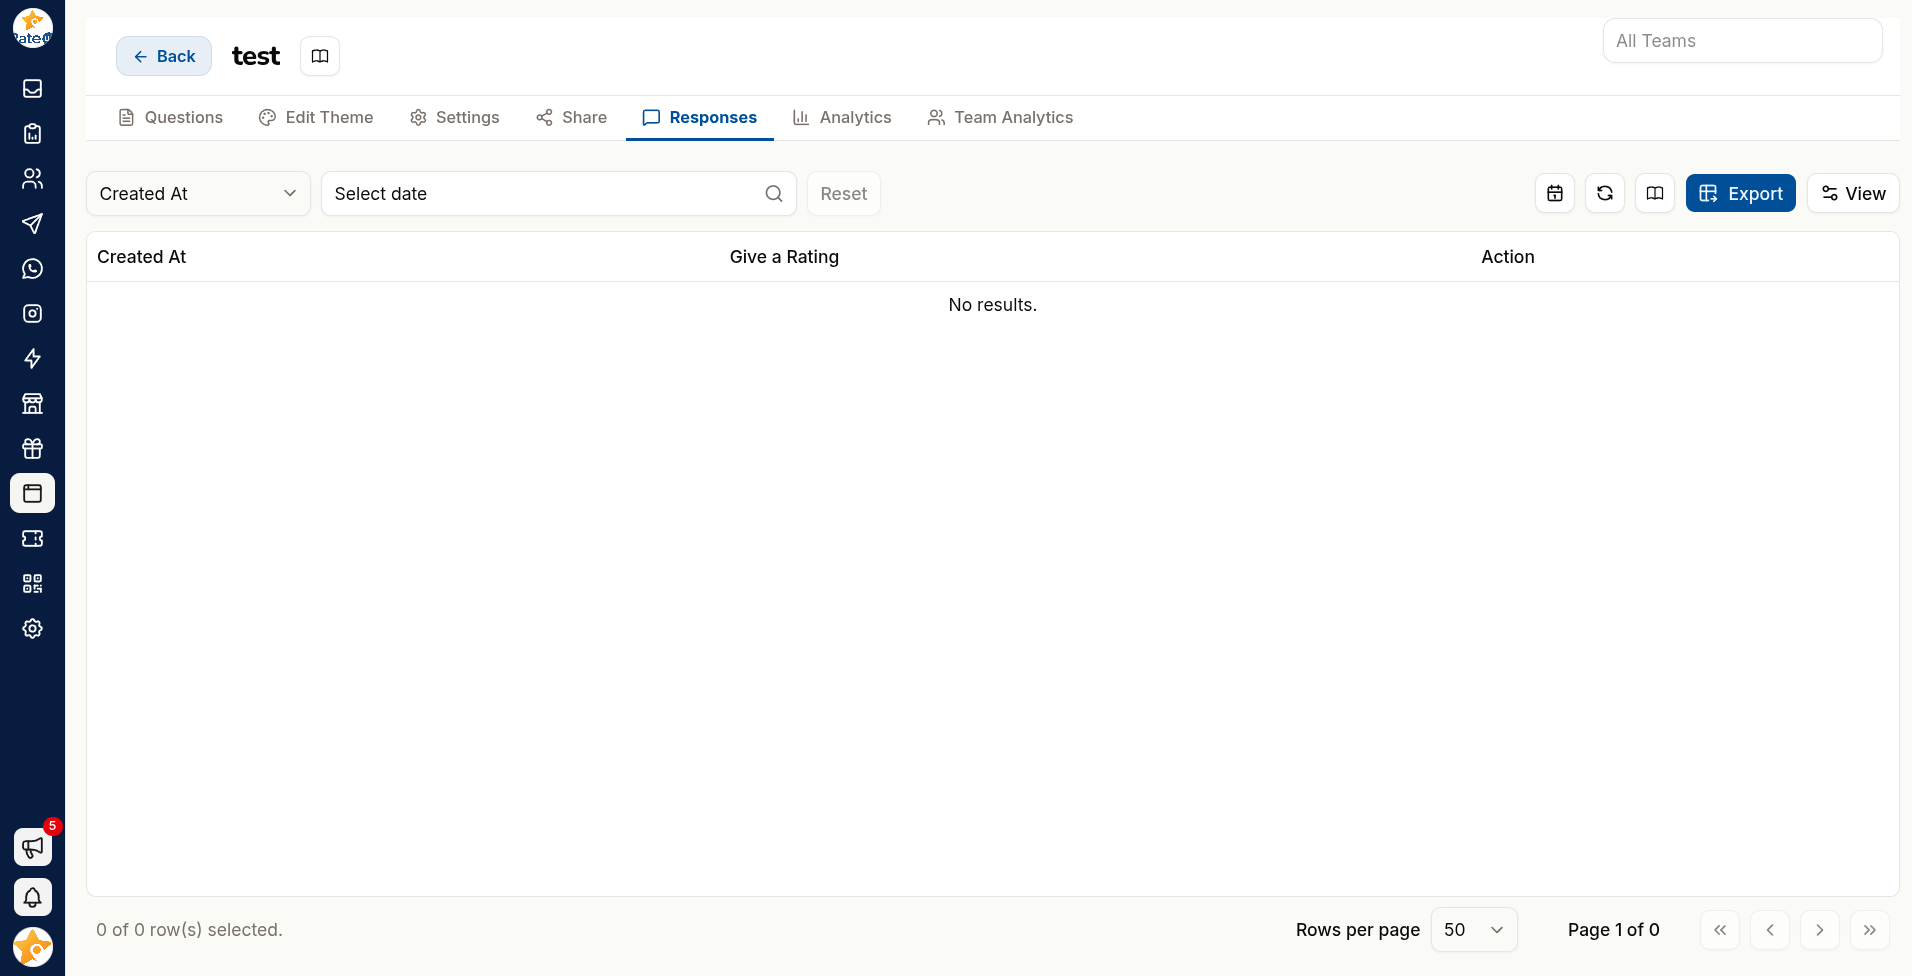
Responses
Every individual submission, with its answers, timestamp and any URL tags it carried. Search it, narrow it with the column filters and the date-range picker, and Refresh to pull in new submissions.
Read these when you need the detail: a specific complaint, a lead's contact details, the wording someone used.
Analytics
"No data to analyse yet" shows until the first response arrives — "Charts appear here once the first responses come in."
The headline numbers
| Card | Counts |
|---|---|
| Total Responses | Completed submissions |
| Started | Visitors who began answering |
| Total Visits | How many times the survey was opened |
| Google Review Redirects | Respondents sent on to a review page — see Automations |
| Response Rate | Responses as a share of visits, with a band: Great (70% or more), Good (50%+), Low (30%+) or Too Low |
Happiness Index
"How respondents felt, from their scale answers." A score Out of 10, labelled by band:
| Score | Label |
|---|---|
| 9 to 10 | Very Happy |
| 7 to under 9 | Happy |
| 5 to under 7 | Neutral |
| 3 to under 5 | Unhappy |
| Under 3 | Very Unhappy |
Below the score, the same five moods show how many responses fell into each.
NPS Overview
"Promoters minus detractors, from −100 to +100." A gauge shows the score, labelled Excellent (50 or more), Great (30+), Okay (0+) or Poor (below 0), with the three groups beneath:
| Group | Score given | Meaning |
|---|---|---|
| Promoters | 9–10 | Will recommend you |
| Passives | 7–8 | Satisfied but not enthusiastic |
| Detractors | 0–6 | Unhappy, and may say so |
Passives are the opportunity. Promoters already advocate and detractors are a rescue job; passives are the group closest to becoming promoters if you find out what is missing. Use a logic jump to ask them specifically.
Question breakdown
"How each answer was distributed." Every question gets its own chart — vote counts for choice and rating questions, with the Most voted answer marked, and response listings for free text.
Export to PDF saves the Analytics tab as a report.
Compare Teams
Team Analytics shows the same result set between teams — useful when several branches or departments run the same survey and you need to know which is ahead.
| Chart | Shows |
|---|---|
| Team Response Activity | How many responses each team collected |
| Team Question Activity | Answers to each question, team by team — as a Bar, Pie or Radar chart |
"No responses found for comparison" means the selected teams have nothing to compare yet.
Summarise Long Answers with AI
| Feature | Produces |
|---|---|
| Generate Summary by AI | A written summary of the responses |
| Generate Team wise summary | The same, broken down by team |
| Large Text Summary | A digest of long free-text answers |
This is most valuable on free text, where hundreds of paragraphs are otherwise unreadable.
Treat a summary as a starting point, not a finding. Read a sample of the raw responses before acting — a summary smooths over exactly the sharp, specific complaint you most needed to see.
Export Responses
Export on the Responses tab offers:
| Menu item | Gives you |
|---|---|
| Download as Excel | The responses as .xlsx, with the columns currently shown |
| Download as OpenDocument (ODS) | The same, as .ods |
| Sync with Google Sheet | Creates a spreadsheet in a RateUp folder in your connected Google Drive, with one tab per language (one tab for a WhatsApp Flow survey), and fills it with every response. After that, each new response is added as a row as it arrives |
| Resync with Google Sheet | Shown once a sheet exists. Rewrites the whole sheet from the current responses, after a confirmation |
Once a survey is synced, its Sheet Url appears under GoogleSheet in the survey's Settings. Google Sheets must be connected under Integrations first.
Export is not offered on an encrypted survey.
Exports contain whatever respondents told you, including contact details. Treat them as personal data.
Filter before exporting — by team, date or response content — rather than exporting everything and trimming later.
Acting on Results
A survey nobody acts on trains customers not to answer the next one.
| Signal | Action |
|---|---|
| Detractor response | Follow up personally — see Automations |
| Repeated complaint about one thing | Fix the thing; the survey has done its job |
| Promoters | Ask for a Google review or a testimonial |
| Falling response rate | The survey is too long, or you are asking too often |
Related Pages
- Automations — review routing and following up
- Settings — the response webhook and Google Sheet link
- Testimonials
- Sharing