Analytics Overview
Get a high-level view of conversations, response times, resolution rates, and channel usage in RateUp.
The Analytics Overview dashboard provides a real-time summary of your team’s performance and conversation activity. It is designed to help admins and managers quickly assess system health without drilling into individual agents.
Dashboard Overview
The Overview page combines multiple analytics blocks such as performance metrics, conversation trends, response patterns, and channel distribution.
Each section is explained below using focused, readable screenshots.
Performance Metrics
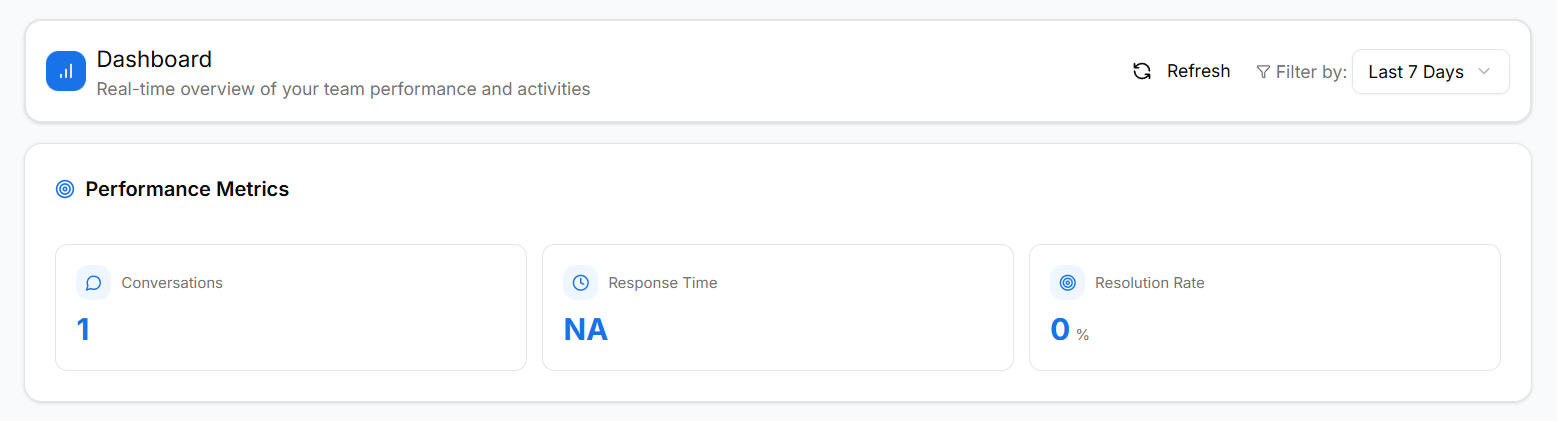
Metrics Included
- Conversations – Total number of conversations in the selected period
- Response Time – Average time taken to respond to customers
- Resolution Rate – Percentage of conversations marked as resolved
These metrics help measure overall team efficiency.
Quick Stats
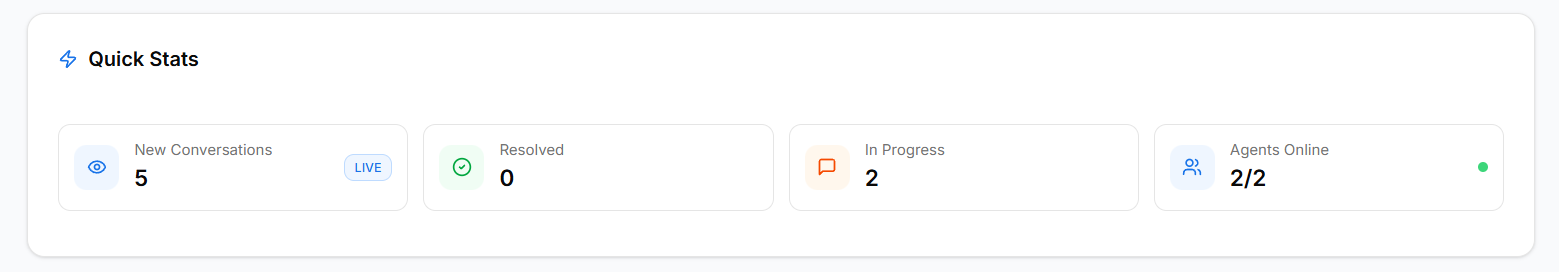
What Quick Stats Show
- New conversations
- Resolved conversations
- Conversations in progress
- Number of agents currently online
This section gives an instant snapshot of Inbox activity.
Conversation Trends
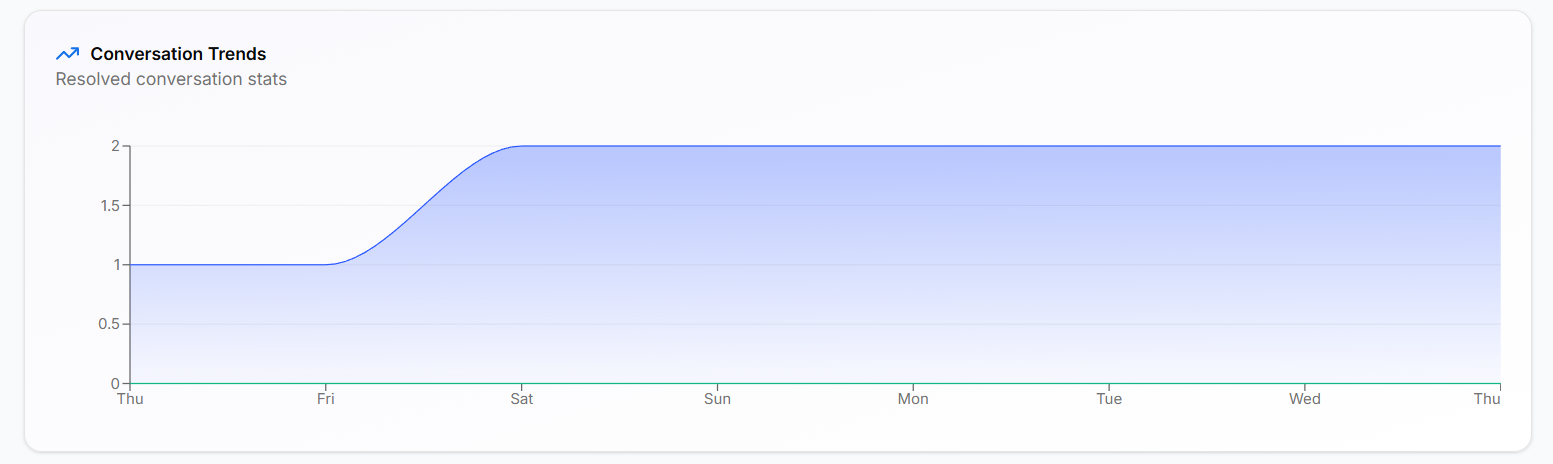
The conversation trends chart shows how conversations are handled over time, helping identify peak days and workload patterns.
Response Time Pattern
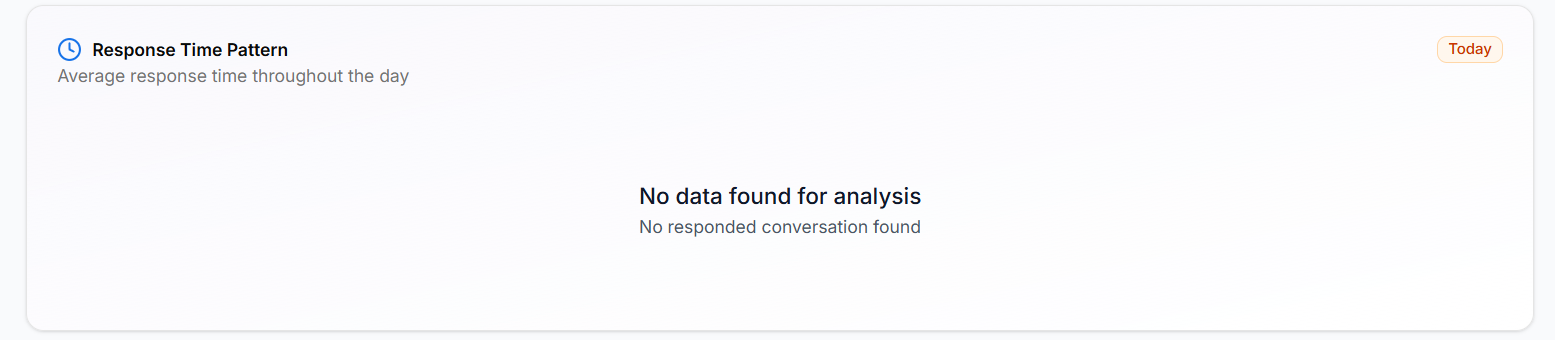
This chart displays how average response times vary throughout the day. If no responses are available, the chart may show a no-data state.
Channel Distribution
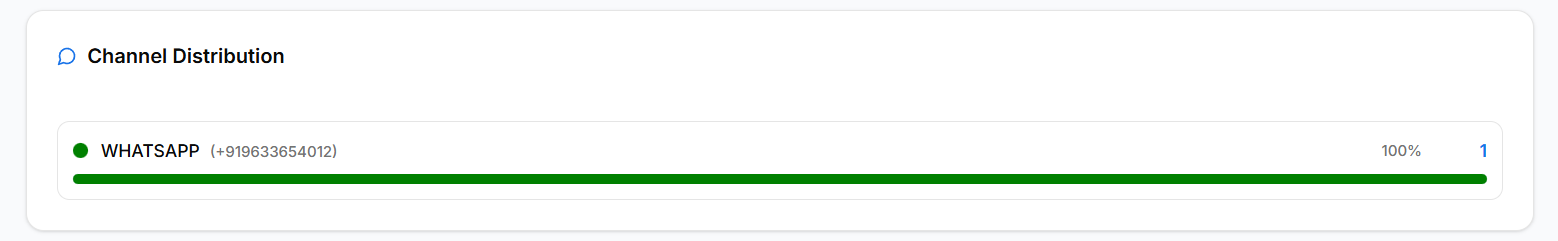
Channel distribution shows which communication channels customers use most, such as WhatsApp, helping teams prioritize channel-specific strategies.
Filters & Refresh
Use the date range filter and Refresh button in the top-right corner to analyze performance for different time periods.
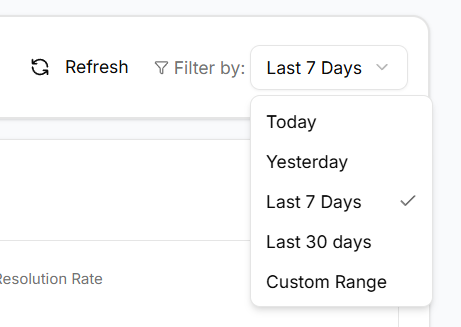
The Date Range Filter allows you to control the time period used for all analytics data on the Overview dashboard.
Available Options
- Today – Shows data for the current day
- Yesterday – Shows data from the previous day
- Last 7 Days – Displays data from the past week
- Last 30 Days – Displays data from the past month
- Custom Range – Select a specific start and end date
All charts and metrics update automatically when the date range changes.