Analytics
Team Performance
The same performance picture, grouped by team rather than by individual.
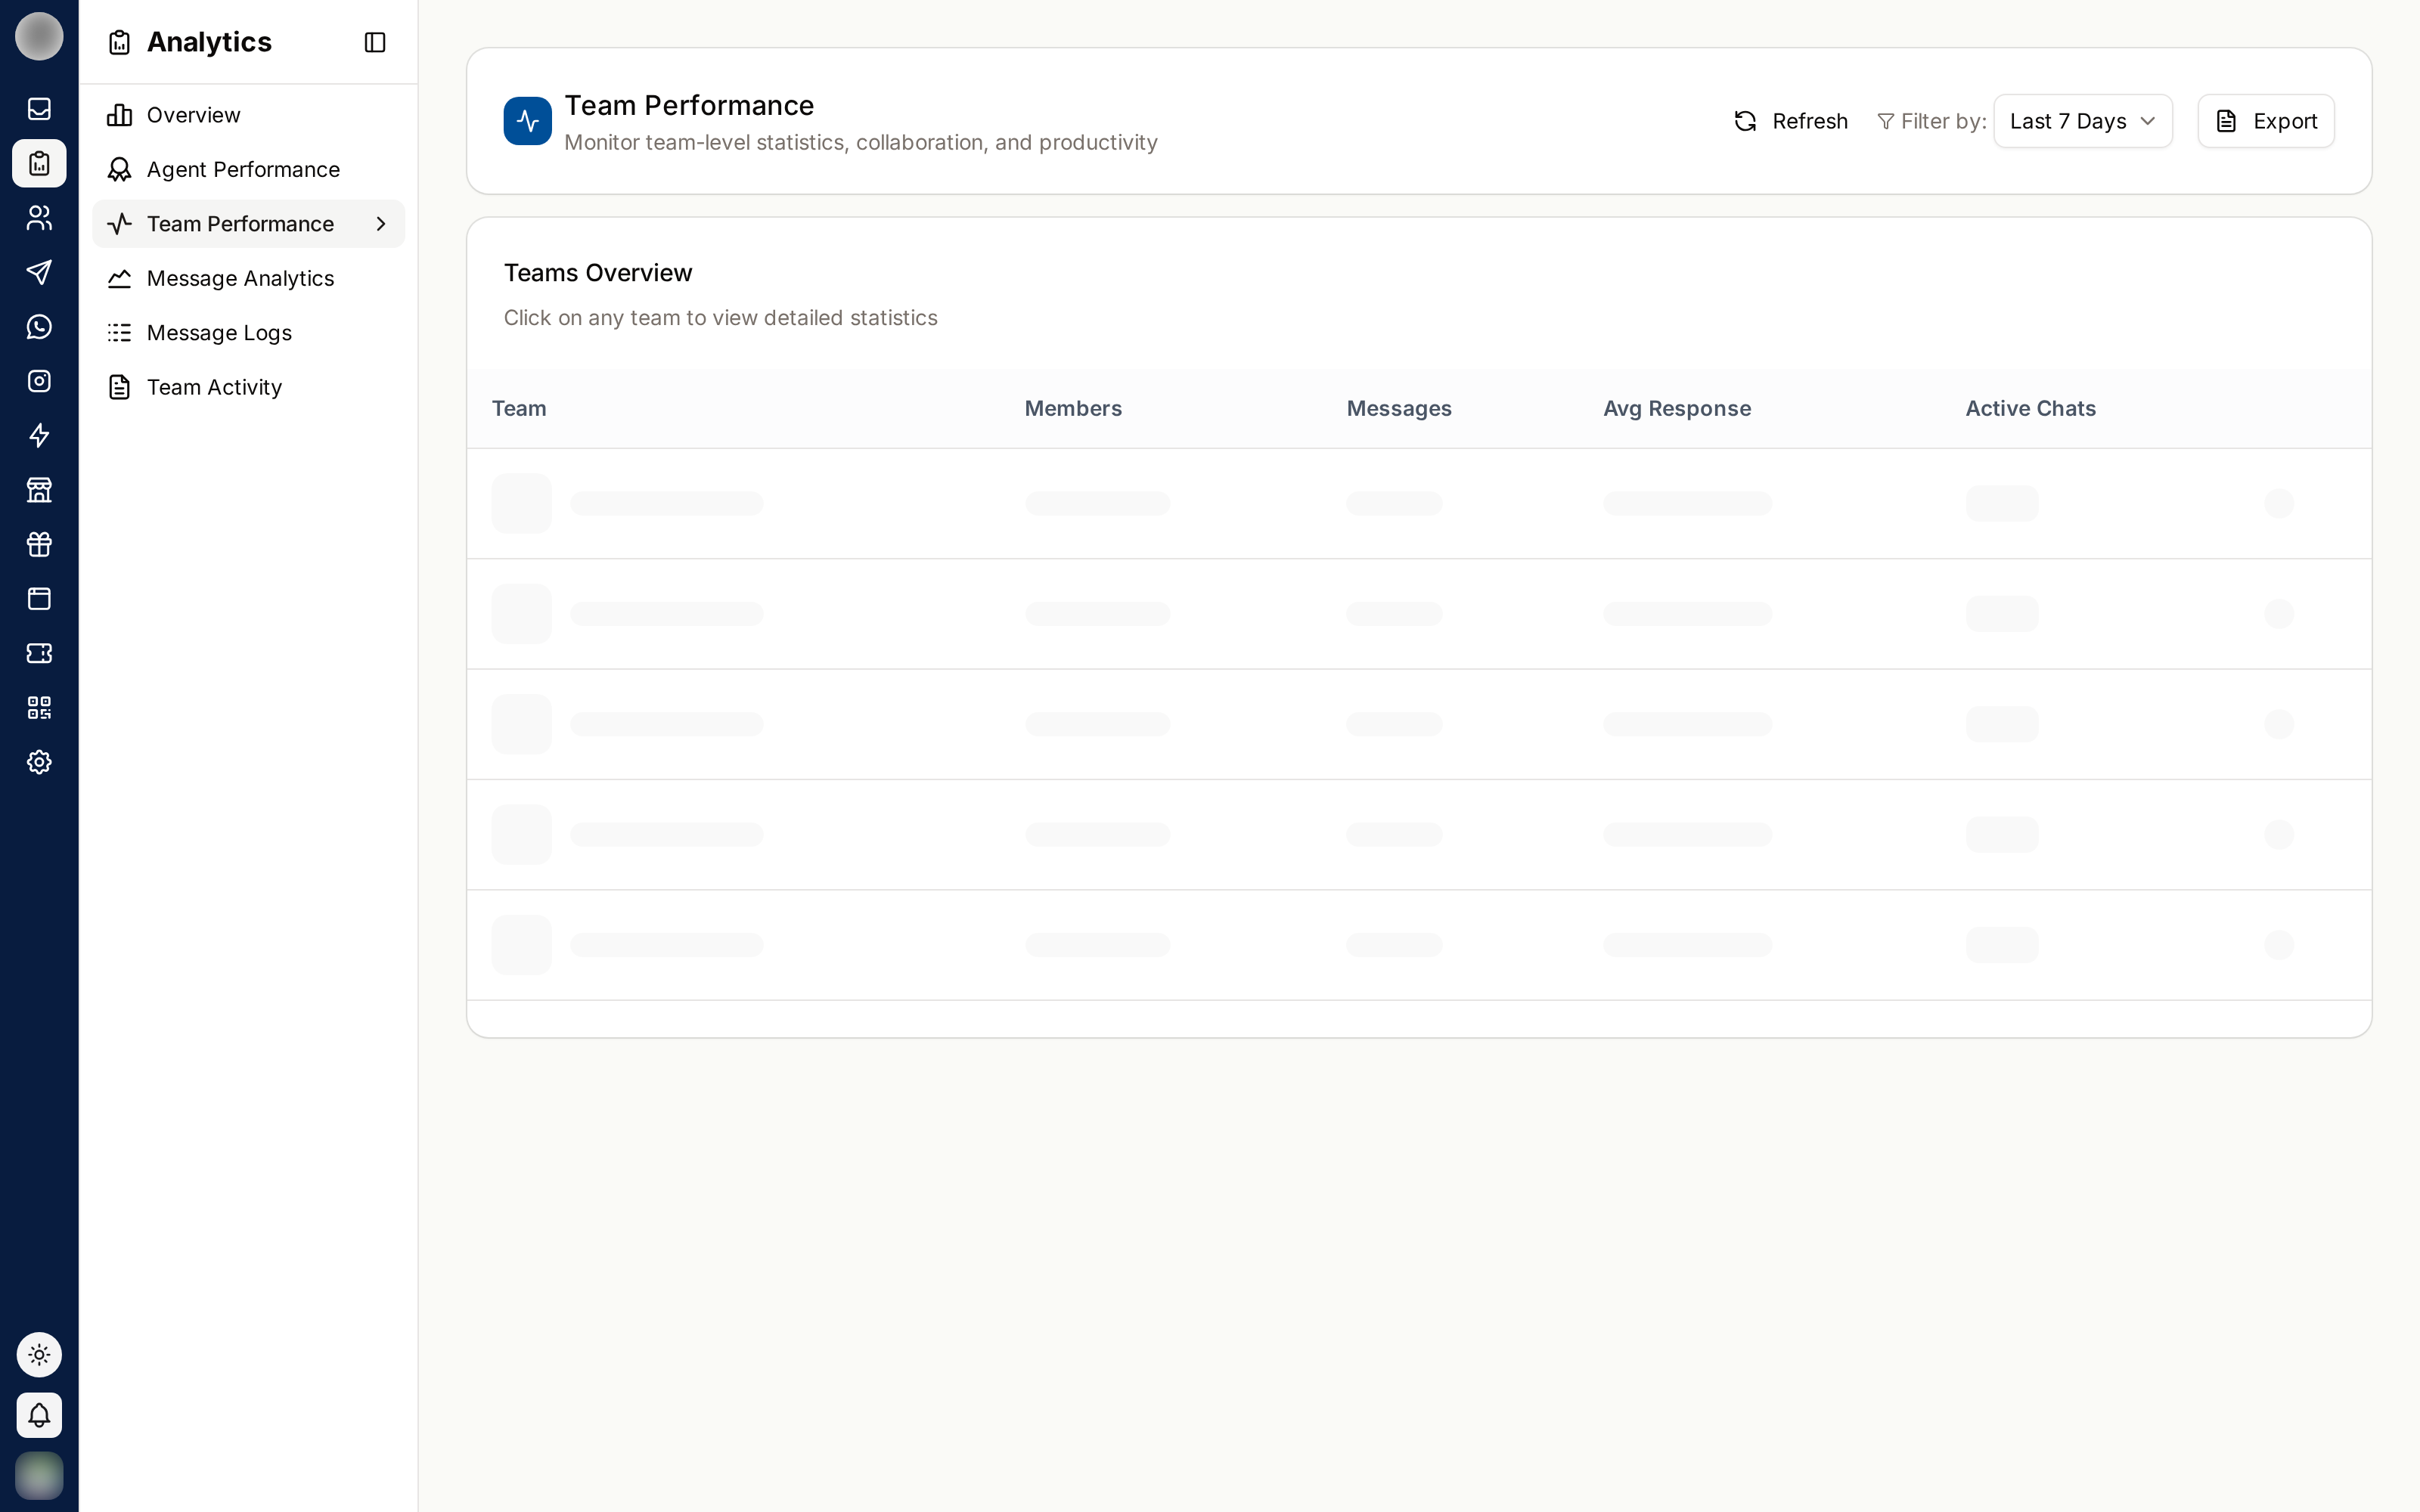
Team Performance aggregates the agent metrics by team. It is the view for deciding where to put people, rather than how any one person is doing.
The Metrics
| Column | Meaning |
|---|---|
| Team | The team |
| Members | How many people are in it |
| Conversations | Tickets the team handled |
| Avg Response | The team's average time to reply |
| Resolution Rate | Share closed with a resolved outcome |
Load per Head
The number that matters is rarely the raw total — it is conversations divided by members.
A team of eight handling 400 conversations is doing half the work per person of a team of three handling 300. The totals hide it; the ratio does not.
What This View Answers
| Question | How to read it |
|---|---|
| Which team is stretched? | High conversations per member, rising response time |
| Where should the next hire go? | The team whose response time degrades as volume grows |
| Is routing working? | A team with very low volume may not be receiving what it should |
| Which team needs process help? | Reasonable volume, poor resolution rate |
Before Drawing Conclusions
Teams handle different work. A billing team's conversations are longer and slower than a first-line support team's by nature. Compare a team against its own history, not against a different team.
Related Pages
- Agent Performance
- Teams — how teams are defined
- Sidebar Filters