Analytics
Agent Performance
Per-agent conversation volume, response times and resolution rates.
Agent Performance breaks the numbers down by person.
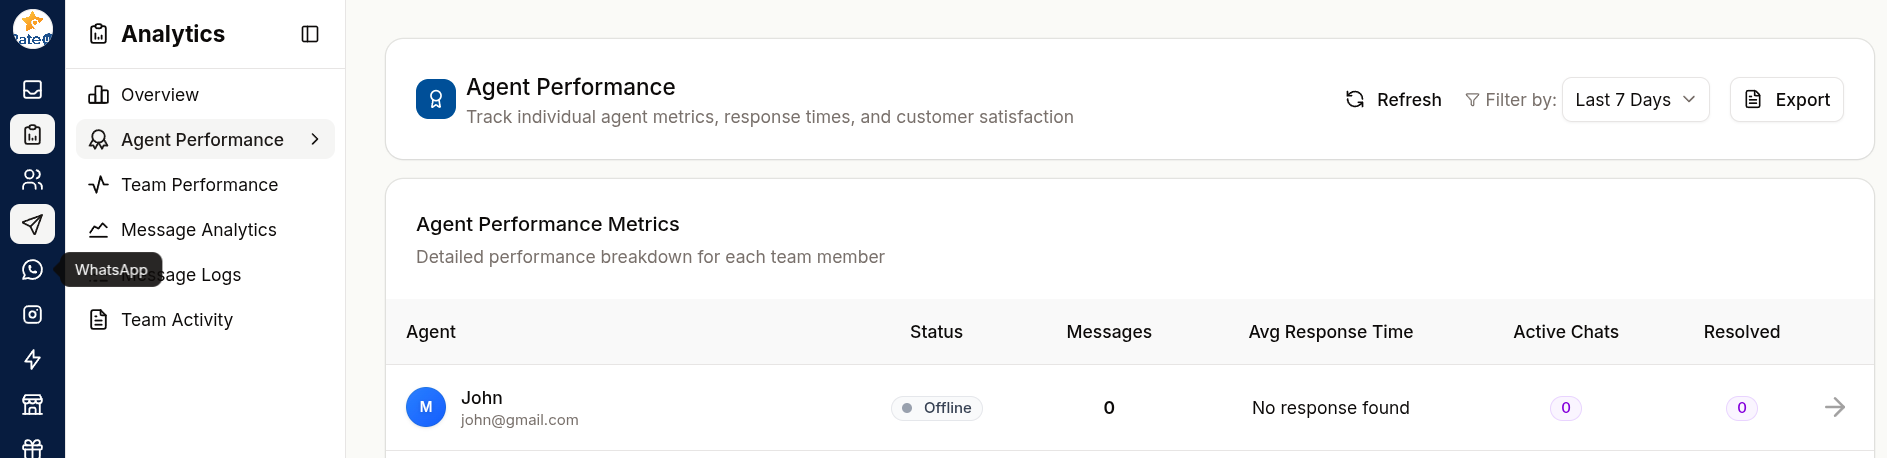
The Metrics
The table is headed Agent Performance Metrics — "Detailed performance breakdown for each team member".
| Column | Meaning |
|---|---|
| Agent | The team member |
| Status | Whether they are online now |
| Messages | Messages they sent in the period |
| Avg Response Time | Their average time to reply |
| Active Chats | Conversations they currently have open |
| Resolved | Tickets they closed with a resolved outcome |
Filtering
Filter by team to compare like with like, and change the date range to match the period you care about. If no agents match, the table shows "No staff found".
Using This Fairly
Agent metrics are easy to misread. A few cautions worth holding onto:
Volume is not productivity. An agent handling complex escalations will show fewer conversations and slower response times than one answering "what are your hours?" all day.
- Compare within a role, not across the whole organisation
- Response time depends on shift — someone covering quiet hours looks fast for reasons that have nothing to do with them
- Resolution rate depends on closing habits — an agent who closes honestly will look worse than one who marks everything resolved
- Use the numbers to start a conversation, not to end one
What to Actually Look For
| Pattern | Likely meaning |
|---|---|
| One agent far slower than peers on the same shift | Workload, tooling or training |
| Everyone slower at the same hours | A rota gap — see Response Time Pattern |
| High volume, low resolution rate | Tickets are being touched but not finished |
| Low volume, high resolution rate | Possibly cherry-picking easy tickets |