Forecast
Open leads bucketed by the month they should close, weighted by each stage's probability.
Forecast answers one question: how much is likely to land, and when. It groups your open leads by their expected close month and weights each one by the win probability of the stage it is in.
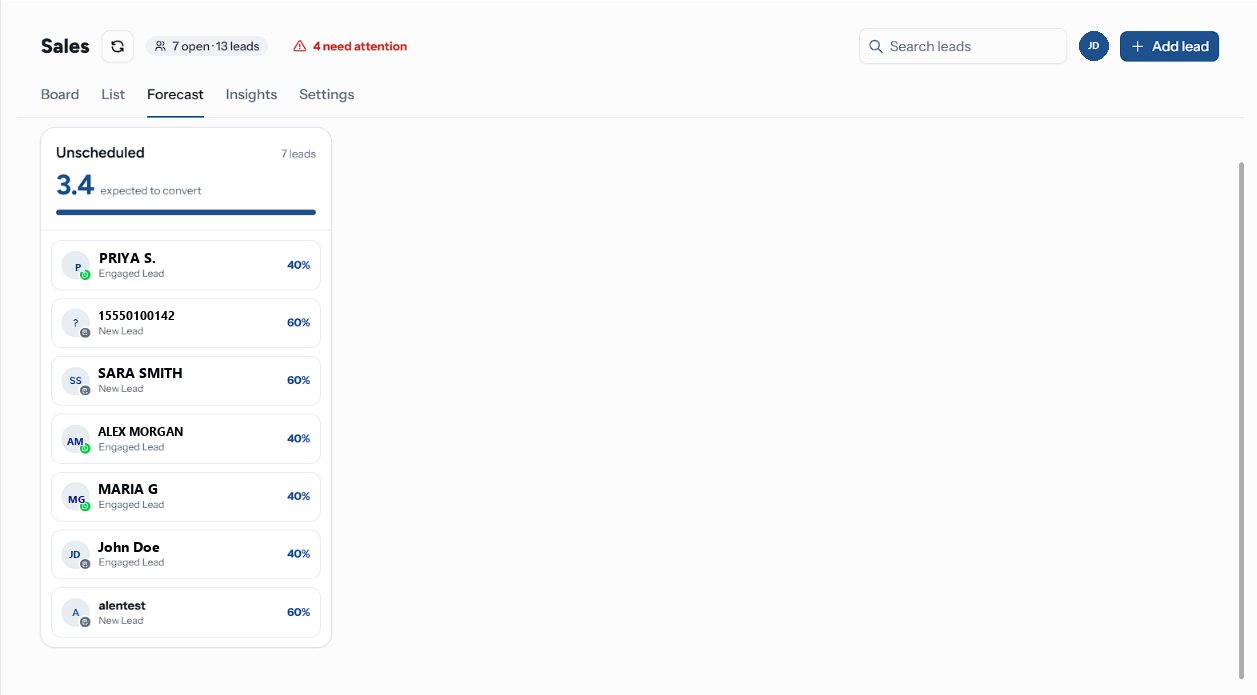
Reading a Column
| Element | Meaning |
|---|---|
| The month | Formatted from each lead's Expected close date |
| {n} leads | How many open leads fall in that month |
| The big number | Expected to convert — the probability-weighted count |
| The bar | That number against the strongest month showing |
| Each row | A lead, with its stage and that stage's probability. Click to open it. A column carries up to twenty cards — the count above them is the answer, the cards are the evidence |
The headline number is deliberately not the raw lead count. Five leads sitting at 20% are one expected win, and the column says 1 rather than 5.
The Unscheduled Column
Open leads with no Expected close date collect in a trailing Unscheduled column rather than being dropped from the view.
An unscheduled lead is invisible to your forecast in every other respect, so the column is usually the most important one on this screen. If it is the tallest column you have, the forecast is not measuring your pipeline — it is measuring the part of it somebody remembered to date.
Set a date from the lead drawer's Expected close field — see Working a Lead.
What It Includes
Only open leads. Won and lost leads have already landed, so they belong in Insights rather than a forecast.
Every open lead on the board, counted on the server. The sidebar's facets and the search box narrow the Board and List views only — they do not narrow the forecast, which answers "what is this pipeline expected to close" rather than "what is it expected to close under the filter I left on". To read one person's forecast, open Insights for their win rate, or the List filtered to them.
Related Pages
- Insights — what has already happened
- Stages — where the probabilities come from
- Working a Lead