Insights
Funnel, where leads stall, where they come from, and how each assignee is doing.
Insights is the board's health in four panels and four headline figures. Every one of them is counted on the server over the whole board: the sidebar's facets and the search box narrow the Board and the List, and leave this report alone. It answers "how is this pipeline doing", not "how is it doing under the filter I left on".
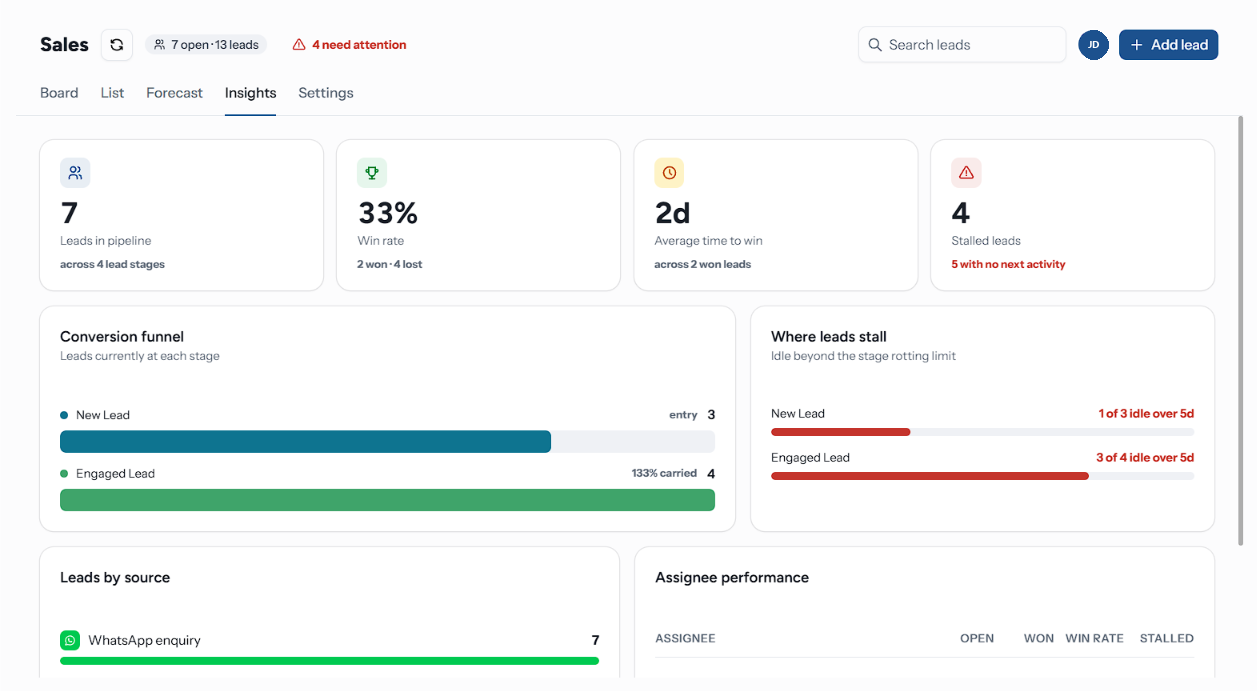
The Four Figures
| Card | What it counts |
|---|---|
| Leads in pipeline | Open leads, with the number of lead stages under it |
| Win rate | Won as a share of everything closed — won and lost. An em dash until something closes |
| Average time to win | Days from creation to close, across won leads only |
| Stalled leads | Leads flagged as needing attention, with how many have no next activity |
Average time to win is deliberately end-to-end rather than time-in-stage: it says how long a sale takes, not how slow the board is. With nothing won yet it reads Nothing won yet.
If Flag stalled leads is off for the board, the stalled card says Rotting checks are off rather than reporting a zero it cannot stand behind.
Conversion Funnel
One bar per open stage, in board order, showing how many leads sit there now. Closing columns are left out — they are the funnel's outcome, not a step along it.
Each row is labelled with what carried from the stage above: "72% carried". The first row reads entry, since nothing feeds it. The label turns red below 70%, which is the point where a stage is losing more than it passes on.
This is a snapshot of where leads are standing, not a historical conversion rate. A stage that has just been cleared reads narrow even if everything that passed through it converted.
Where Leads Stall
One row per open stage that has a rotting window, healthy ones included. Each bar is that stage's own stalled share — "3 of 11 idle over 5d" — so a row answers "how much of this column has gone quiet" rather than only ranking columns against each other. A stage with nothing stuck reads all healthy in green.
Stages with no rotting window are left out entirely: nothing there can be late. If the panel says "No stage has a rotting window set", set one in Stages.
Leads by Source
Every source in use, ranked, with a bar scaled against the largest. This counts every lead on the board, closed ones included — it answers where your leads come from, not which ones are still live.
A loud source is not the same as a good one: read it against Assignee performance and the funnel, and use the sidebar's Sources rows on the Board or the List to go and look at the leads themselves.
Assignee Performance
One row per person, plus an Unassigned bucket.
| Column | Meaning |
|---|---|
| Open | Leads they are on that are still open |
| Won | Leads they were on that closed won |
| Win rate | Won as a share of everything they closed. Green at 50% or above, an em dash with nothing closed |
| Stalled | How many of theirs have gone quiet. An em dash rather than a zero |
A lead worked by two people counts for both of them, so these columns sum to more than your lead count. That is the point — the table reads per person, not per lead — but it means you cannot add the rows up to check them against the board.