Commerce
Overview
Sales, orders, average order value and top products at a glance.
The Overview page answers the question you ask first every morning: how is the store doing?
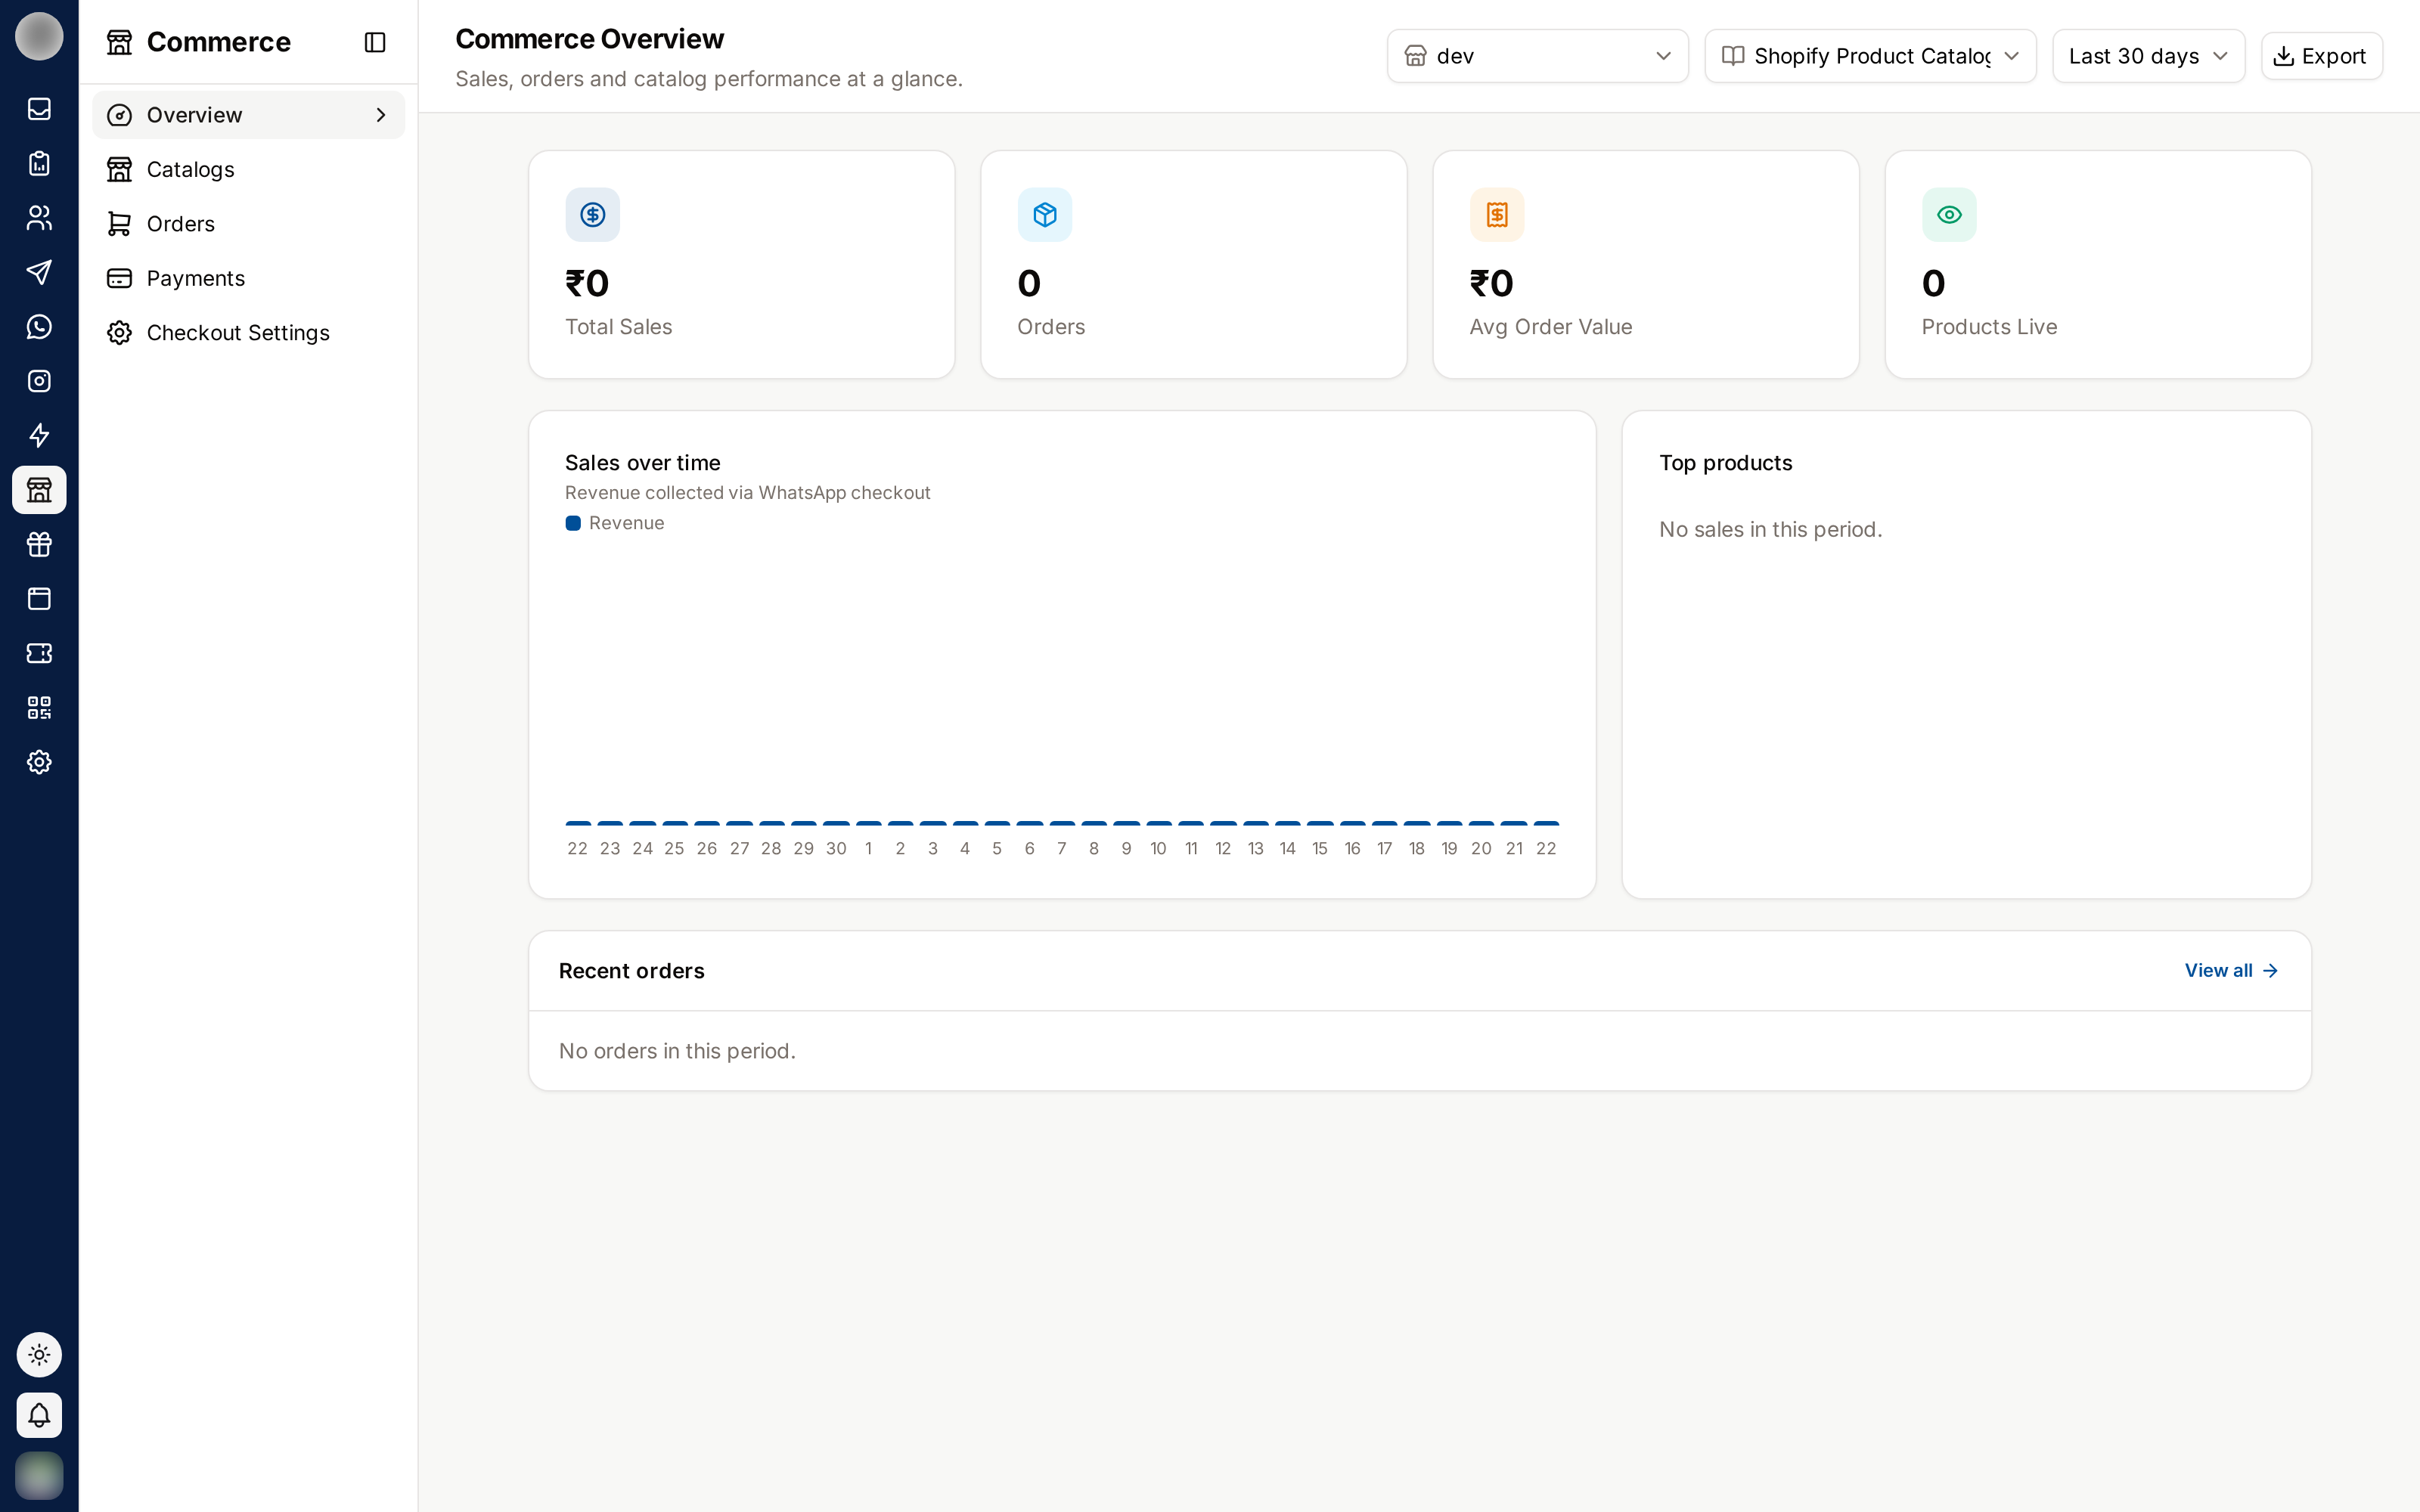
The Headline Numbers
| Card | What it counts |
|---|---|
| Total Sales | Revenue over the selected period |
| Orders | Number of orders placed |
| Avg Order Value | Total sales divided by order count |
| Products Live | Products currently available in the connected catalog |
Sales Over Time
A chart of sales and order volume across the period. Hover any point to see the exact figures for that day.
Use it to spot the pattern behind the totals — a good month driven by one big order looks very different from a good month driven by steady volume.
Top Products
Your best sellers for the period, ranked. Use this to decide what to feature in campaigns, and to notice when a product stops moving.
Recent Orders
The latest orders, with the customer, the stage each has reached, and the date.
Click through to Orders for the full list with filtering.
Reading the Numbers Honestly
- Average order value moves sharply on low volume — treat it as noise until you have enough orders for it to mean something
- Products live counts what is available, not what is selling; a high number with flat sales usually means the catalog needs curating, not expanding
- Compare periods rather than reading a single number in isolation